
Customer satisfaction is the lifeblood of any successful business, and in today’s competitive marketplace, it’s more important than ever to stay on top of your game. That’s why we’ve put together a list of 12 customer satisfaction metrics you can track in 2023.
These metrics will help you keep your finger on the pulse of your customer’s needs and expectations, so you can continue to provide exceptional service and drive growth for your business. So buckle up, and let’s dive in!
What is Customer Satisfaction, and Reasons to Measure It?
Customer satisfaction refers to a customer’s overall level of happiness or contentment with a product or service they have received from a business. It’s a measure of how well a company has met or exceeded its customers’ expectations.
As a business owner or manager, it’s essential to measure customer satisfaction for several reasons:
- Firstly, satisfied customers are more likely to become loyal customers, leave positive reviews, and recommend your business to their friends and family. In fact, research also shows that 93% of consumers base their buying decisions on positive online reviews. Therefore, providing a satisfactory customer experience is crucial for businesses to attract and retain customers.
- Secondly, measuring customer satisfaction helps businesses identify areas where they need to improve. By asking for feedback, you can gather information on what your customers like and dislike about your products or services. This can help you identify areas where you need to make changes or improvements to meet their needs better.
- Finally, measuring customer satisfaction can be an excellent way to gauge the effectiveness of your marketing and customer service efforts. If your customers are happy with your business, it’s a sign that you’re doing things right. If they’re unhappy, it’s an indication that you need to make changes to improve the customer experience.
- Customer satisfaction metrics also act as performance metrics for customer representatives, and they can be used while evaluating their performance and making promotion or recognition decisions.
- Furthermore, companies with high levels of customer satisfaction tend to have higher revenue growth rates than those with low levels of customer satisfaction. According to a recent study, satisfied customers contribute 17 times more to revenue as compared to dissatisfied customers.
In conclusion, measuring customer satisfaction is crucial for any business that wants to succeed in today’s competitive marketplace. By focusing on meeting your customer’s needs and expectations, you can build a loyal customer base and grow your business over time.
Now that we know why measuring customer satisfaction is important for businesses, let’s have a closer look at all the essential metrics that you should keep an eye on.
12 Essential Customer Satisfaction Metrics
Customer satisfaction metrics are numeric scores that give representative indications of customer experiences. Let’s take a look at some popular customer satisfaction metrics.
1. Net Promotor Score (NPS)
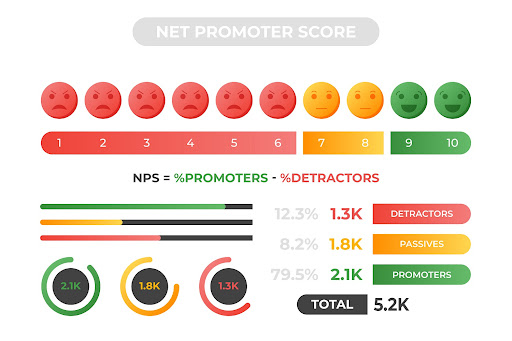
NPS is a customer loyalty metric that measures how likely a customer is to recommend a company to others. Customers are asked to rate how likely they are to recommend a company on a scale of 0 to 10, with 10 being the most likely. Based on the rating, you can classify your customers into:
Promoters – Those who rate 9 or 10. These people are devoted and passionate about the company, item, or service.
Passives – Those who rate 7 or 8. Although they are content customers, they are not overly enthusiastic and could be seduced by rivals.
Detractors – Those who rate between 0 to 6. They might be disparaging your brand by talking negatively about their experiences.
Net Promoter Score (NPS) formula:
NPS = Percentage of Promoters — Percentage of Detractors = (Number of Promoters — Number of Detractors) / (Number of Respondents) x 100
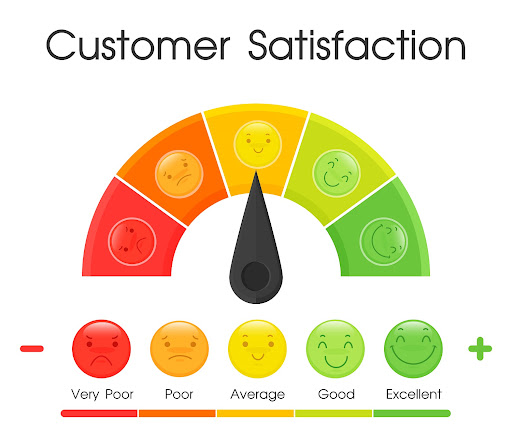
2. Customer Satisfaction Score (CSAT)
CSAT measures a customer’s satisfaction with a specific product or service they received. Customers are asked to rate their level of satisfaction from 1 to 5, with 5 representing the highest level of satisfaction.
The CSAT score is calculated by dividing the total number of satisfied customers (those who rate the company 4 or 5) by the total number of customers surveyed and multiplying by 100.
CSAT Score = (Total Satisfied Customers / Total Customers Surveyed) x 100
You can also conduct surveys by asking relevant customer satisfaction questions to obtain more detailed responses regarding your customers’ experiences with your brand.
3. Customer Service Satisfaction (CSS)
CSS is similar to CSAT but it only measures specific interactions and not the whole business. It measures a customer’s satisfaction with the service they received from a company’s customer support team. Every time a customer interacts with your business, ask them for feedback in order to gauge customer satisfaction.
The CSS score is calculated by dividing the total number of satisfied customers (those who rate the service 4 or 5 on a scale of 5) by the total number of customers surveyed and multiplying by 100.
CSS Score = (Total Satisfied Customers / Total Customers Surveyed) x 100
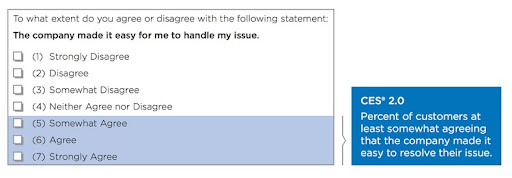
4. Customer Effort Score (CES)
One of the more intriguing metrics for measuring customer satisfaction is CES. It aims to ascertain the amount of effort a customer feels they have expended to achieve their goals.
CES is measured by asking customers how simple their interaction with your business was, as opposed to asking them to rate their level of satisfaction. A numbered scale (e.g., 1 to 7) is used to ask respondents to choose their responses, with 1 denoting “strongly disagree” and 7 denoting “strongly agree.”
CES is calculated by taking the sum of all responses and dividing it by the total number of responses received.
CES Score = Sum of All Responses / Total Responses Received
For example, if the sum of all responses is 250 and the total responses received is 50 then your CES score will be 5. A CES score above 5 is considered a good CES score.
5. Abandonment Rate
The percentage of customers who stop interacting with your business before a request or action has been fulfilled is known as the abandonment rate. Abandonment rates can gauge a variety of factors about your business, depending on what services you provide and how you run it.
For instance, if your business operates an online store, you can gauge the rate at which shopping carts are abandoned there. According to Baymard Institute, an astonishing 70% of online shopping carts are abandoned, typically as a result of a protracted or challenging checkout process or unexpected fees. To reduce the abandoned cart rate, you should focus on improving overall customer’s online shopping experience.
The abandonment rate is calculated by dividing the number of customers who abandoned the task by the total number of customers who attempted the task and multiplying by 100.
Abandonment Rate = (Number of Customers who Abandoned / Total Number of Customers who Attempted) x 100
6. Customer Health Score (CHS)
How loyal your customers are to your brand can be predicted by looking at your customer health score. Unlike the direct metrics for customer satisfaction, CHS assists in identifying trends in behavior over a predetermined time period, such as product use time frame, spending on the brand, response to your surveys, etc.
Classifying customers into weak, at-risk, and healthy groups will depend on the particulars of each business, but the end result is the same. Then you can spot trends among particular customer types and take proper care of them.
7. Customer Churn Rate (CCR)
CCR measures the percentage of customers who stop using a company’s product or service over a given period. It is crucial to keep your current customers because it can be seven times more expensive to find new ones. Monitoring your CCR enables you to identify any trends that might have an effect on your business and to take action to reduce churn.
The churn rate is calculated by dividing the number of customers lost during the period by the total number of customers at the beginning of the period and multiplying by 100.
CCR = (Number of Customers Lost / Total Number of Customers) x 100
8. First Response Time (FRT)
FRT measures how long it takes for a company to respond to a customer’s inquiry or request for support. The FRT is calculated by measuring the time between when a customer submits a support request and when the company sends the first response to the customer.
This metric is important because it can have a significant impact on a customer’s perception of a company’s customer service. The faster a company responds to a customer’s inquiry, the more likely the customer is to be satisfied with their experience.
FRT = (Sum of all FRTs during a specific time) / (Total number of tickets resolved )
9. First Contact Resolution Rate (FCRR)
FCRR is a metric that measures the percentage of customer inquiries or issues that are resolved during the first interaction with a company’s customer support team, without the need for any follow-up interactions.
This metric is important because it indicates how effective a company’s customer support team is at resolving customer issues and addressing their concerns in a timely manner.
FCRR = (Total number of inquiries resolved during first interaction) / (Total number of inquiries) x 100
10. Ticket Resolution Time
Ticker Resolution Time measures the time it takes for a company to resolve a customer inquiry or issue from the time it was reported to the time it is fully resolved. This metric is important because it directly impacts the customer experience and satisfaction. The longer it takes for a company to resolve a customer issue, the more likely the customer is to become dissatisfied and even churn.
Measuring Ticket Resolution Time allows a company to identify bottlenecks and inefficiencies in its customer support processes and make necessary improvements to reduce resolution time and improve customer satisfaction.
11. Average Ticket Time
Average Ticket Time measures the average amount of time it takes for a company to resolve a customer inquiry or issue, from the time it was reported to the time it is fully resolved. It is an important metric to measure because it provides insights into how long customers are waiting for a resolution.
This helps a company identify areas where it can improve its processes and reduce resolution times. By reducing Average Ticket Time, a company can also increase customer satisfaction and loyalty, as well as improve the efficiency of its customer support team.
Average Ticket Time = (Total time taken to resolve all tickets) / (Total number of tickets resolved)
12. Customer Lifetime Value (CLTV)
CLTV estimates the total value a customer will bring to a company over the entire duration of their relationship. The CLTV formula takes into account the average purchase value, purchase frequency, and customer lifespan.
The higher the CLTV, the more valuable the customer is to the company. Companies can use CLTV to help guide decisions on customer acquisition and retention strategies, as well as to allocate resources to ensure the highest-value customers receive the best possible experience.
CLTV = (Average Purchase Value) x (Average Purchase Frequency) x (Average Customer Lifespan)
Ways to Boost Your Customer Satisfaction Metrics
1. Improve First Response Time
By improving FRT, companies can improve customer satisfaction and loyalty. To improve FRT, companies can use automation tools like chatbots and autoresponders to quickly acknowledge customer inquiries and provide initial support.
Companies can also optimize their customer support workflows and prioritize inquiries based on urgency and complexity to ensure faster resolution times.
2. Make First Contact Resolution a Priority
By prioritizing FCRR, companies can reduce customer frustration and improve customer satisfaction. To improve FCRR, companies can provide their customer support teams with the necessary training, resources, and authority to resolve customer inquiries in a timely and effective manner.
Companies can also leverage customer data to anticipate and address customer needs proactively, reducing the likelihood of follow-up inquiries.
3. Make Use of the Right Tools
There are a variety of customer service tools available to help companies improve their customer satisfaction metrics. These include help desk software, live chat software, customer relationship management (CRM), chatbots, and other automation tools. By leveraging the right tools, companies can streamline their customer support workflows, reduce response times, and increase first-contact resolution rates.
Additionally, tools like customer feedback surveys can provide valuable insights into customer needs and preferences, enabling companies to improve their products and services to better meet customer expectations.
Measure Customer Satisfaction
It’s crucial to select the right customer satisfaction metrics for your company. What matters most, is what you want to know, and how you plan to use the information you find. However, there isn’t a “one size fits all” customer satisfaction metric that meets everyone’s requirements.
It’s a good idea to define your objectives clearly before considering metrics. Once you have your objectives clear, it will be easy to figure out the metrics that cater to your business needs the most. And ultimately, with the right customer satisfaction metrics, you will be able to provide better service, gain and retain more customers, and boost your ROI.
Author Bio – Pratik Shinde is a Freelance Content Marketer and SEO enthusiast. He helps fast-paced B2B SaaS startups acquire customers through organic marketing efforts. He likes reading philosophy, writing non-fiction, thoughtful walking, running, and travelling.